It's critical that security teams have comprehensive visibility into the state of compliance for their cloud workloads, as internal and external stakeholders frequently need timely and accurate answers to questions such as:
- Is the environment compliant with regulations and CIS benchmarks?
- To what extent does the environment comply with security policy rules?
- What trends can we see for failed checks?
Using Prisma Cloud, customers can perform hundreds of distinct compliance checks on cloud native workloads against internal and external standards. Now, to streamline these efforts, we've developed a new dynamic compliance dashboard that provides teams with enhanced visibility into the compliance of cloud native workloads – Compliance Explorer.
Adhering to Leading Compliance Frameworks
The new Compliance Explorer dashboard allows you to compare the state of your workloads against pre-built checks for numerous leading compliance frameworks, including HIPAA, PCI, NIST SP 800-190, GDPR, DISA STIG and CIS Benchmarks.
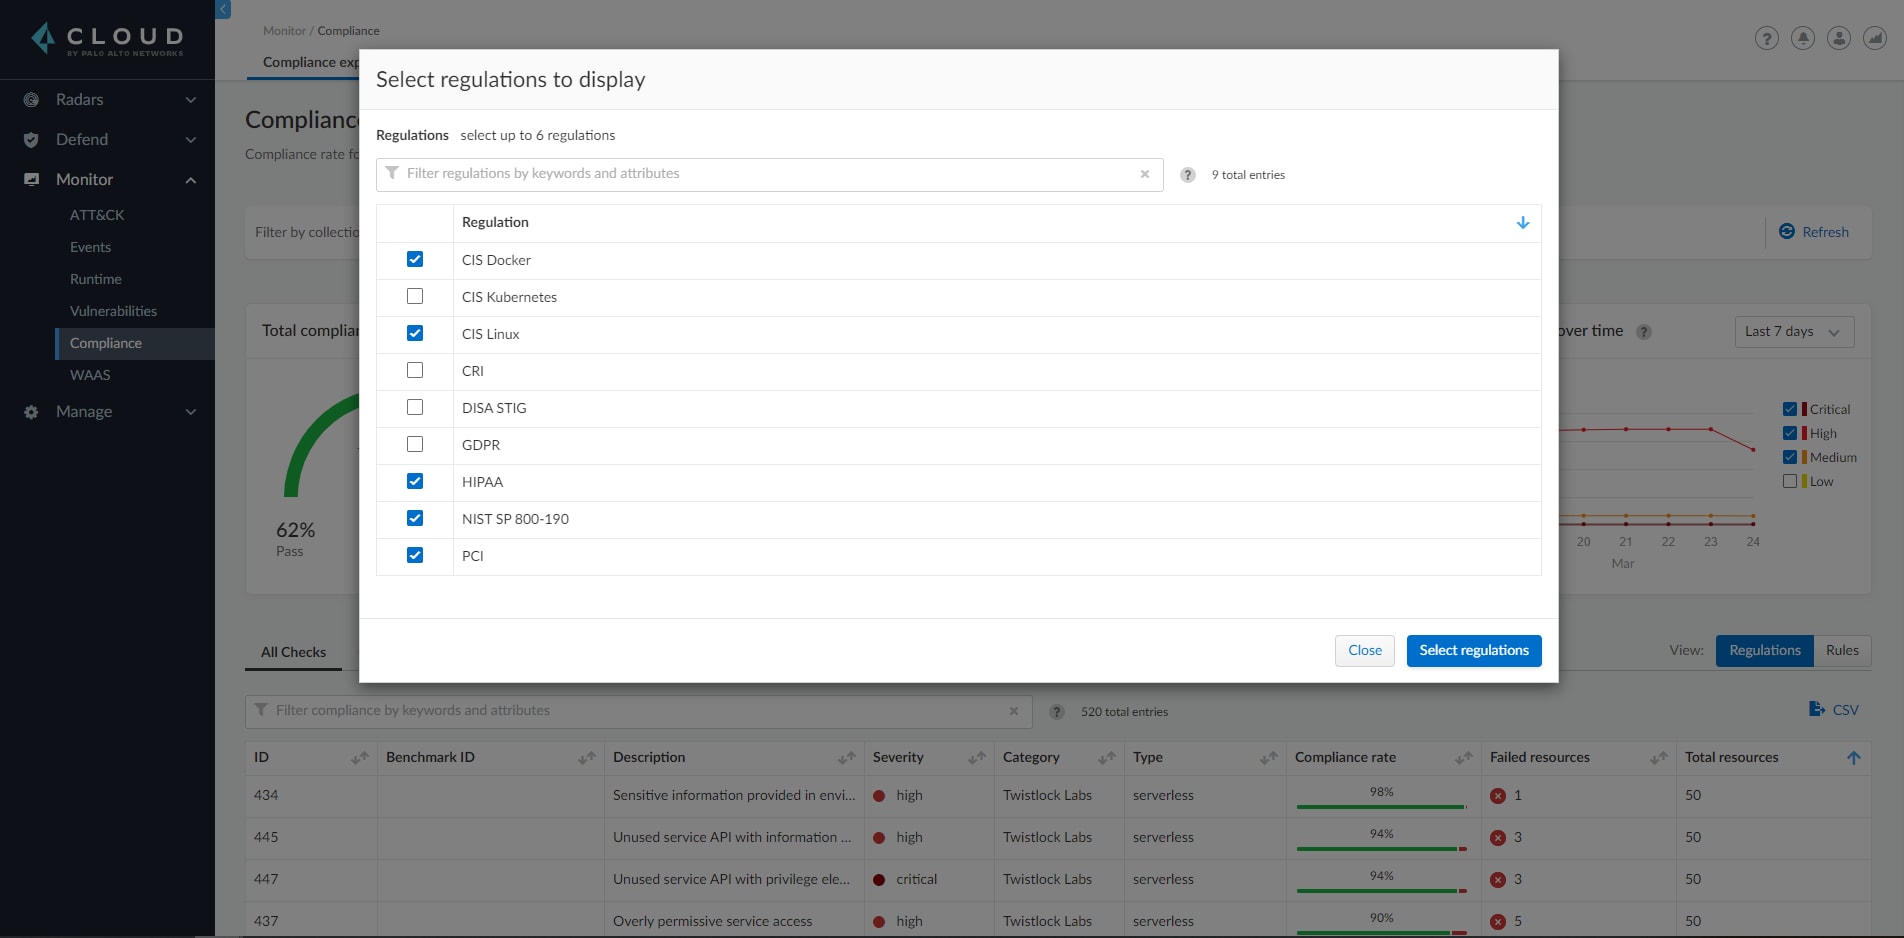
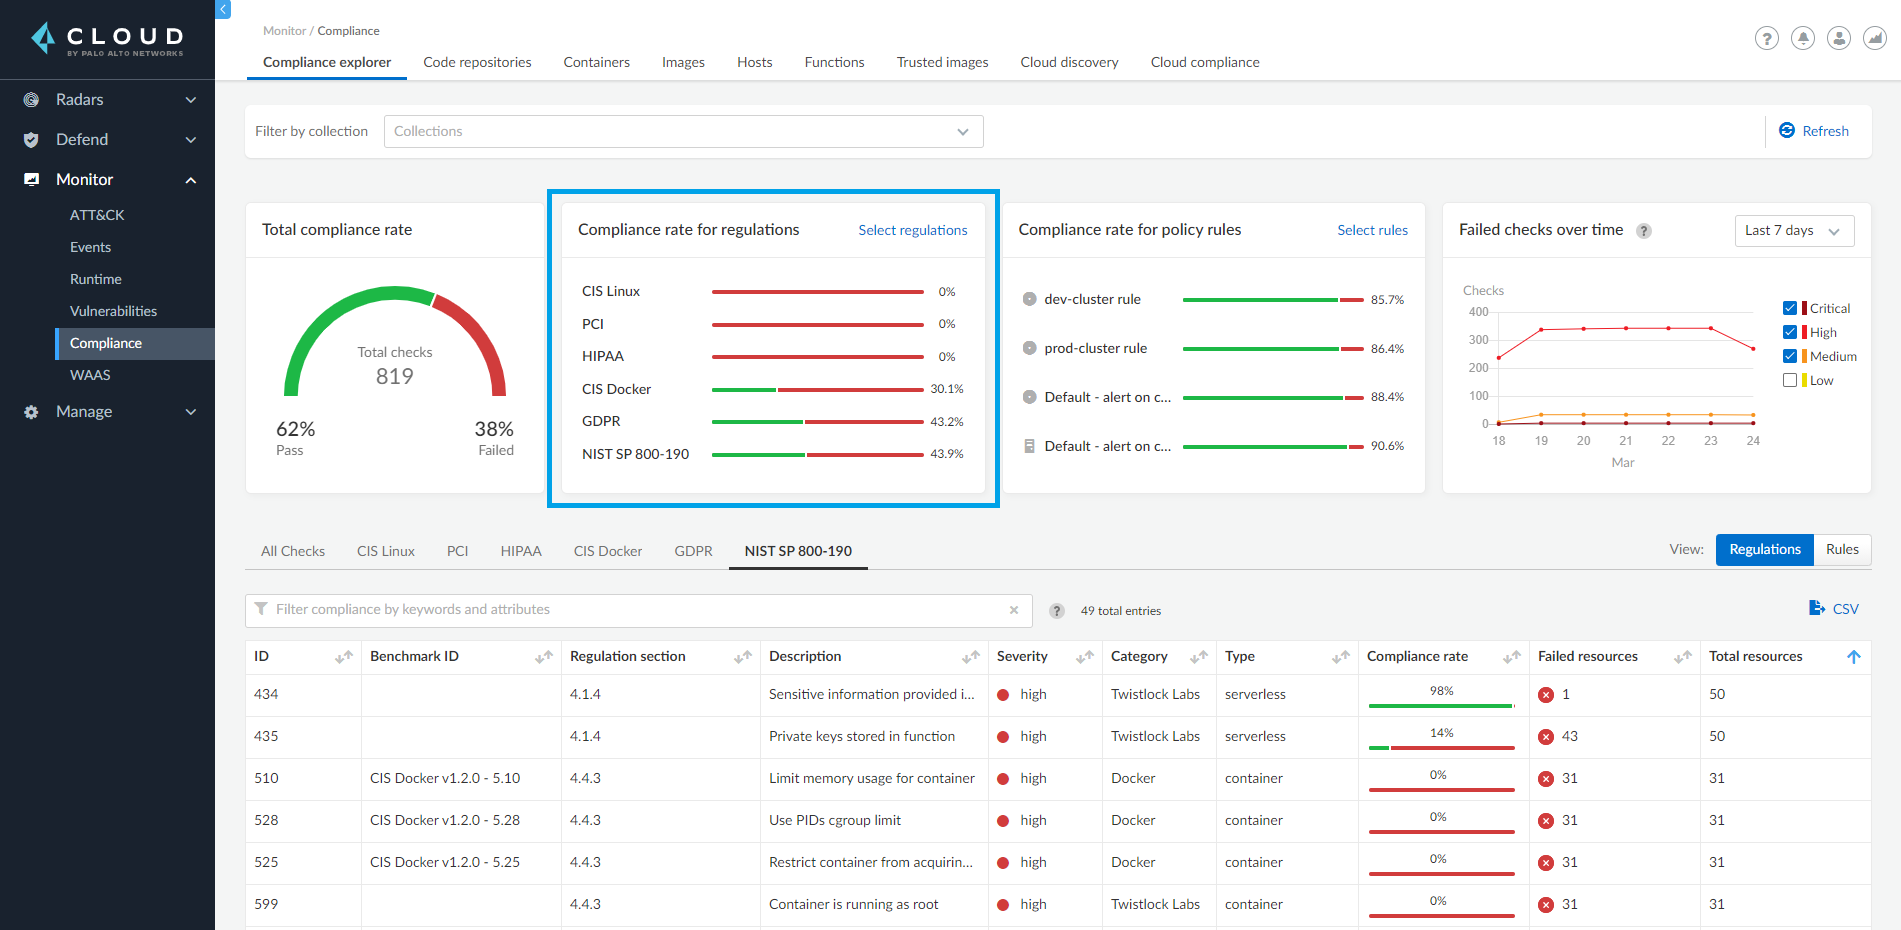
You can select relevant regulations for your environment and immediately view the results as they pertain to scanned containers, images, hosts and serverless functions.
You can easily view the detailed list of compliance checks covering each regulation. Each check is populated with its benchmark ID and regulation section, the total number of evaluated resources, the number of failed checks and the overall compliance rate. You can also sort and filter the data to review the most critical and/or common misconfigurations in your environment.
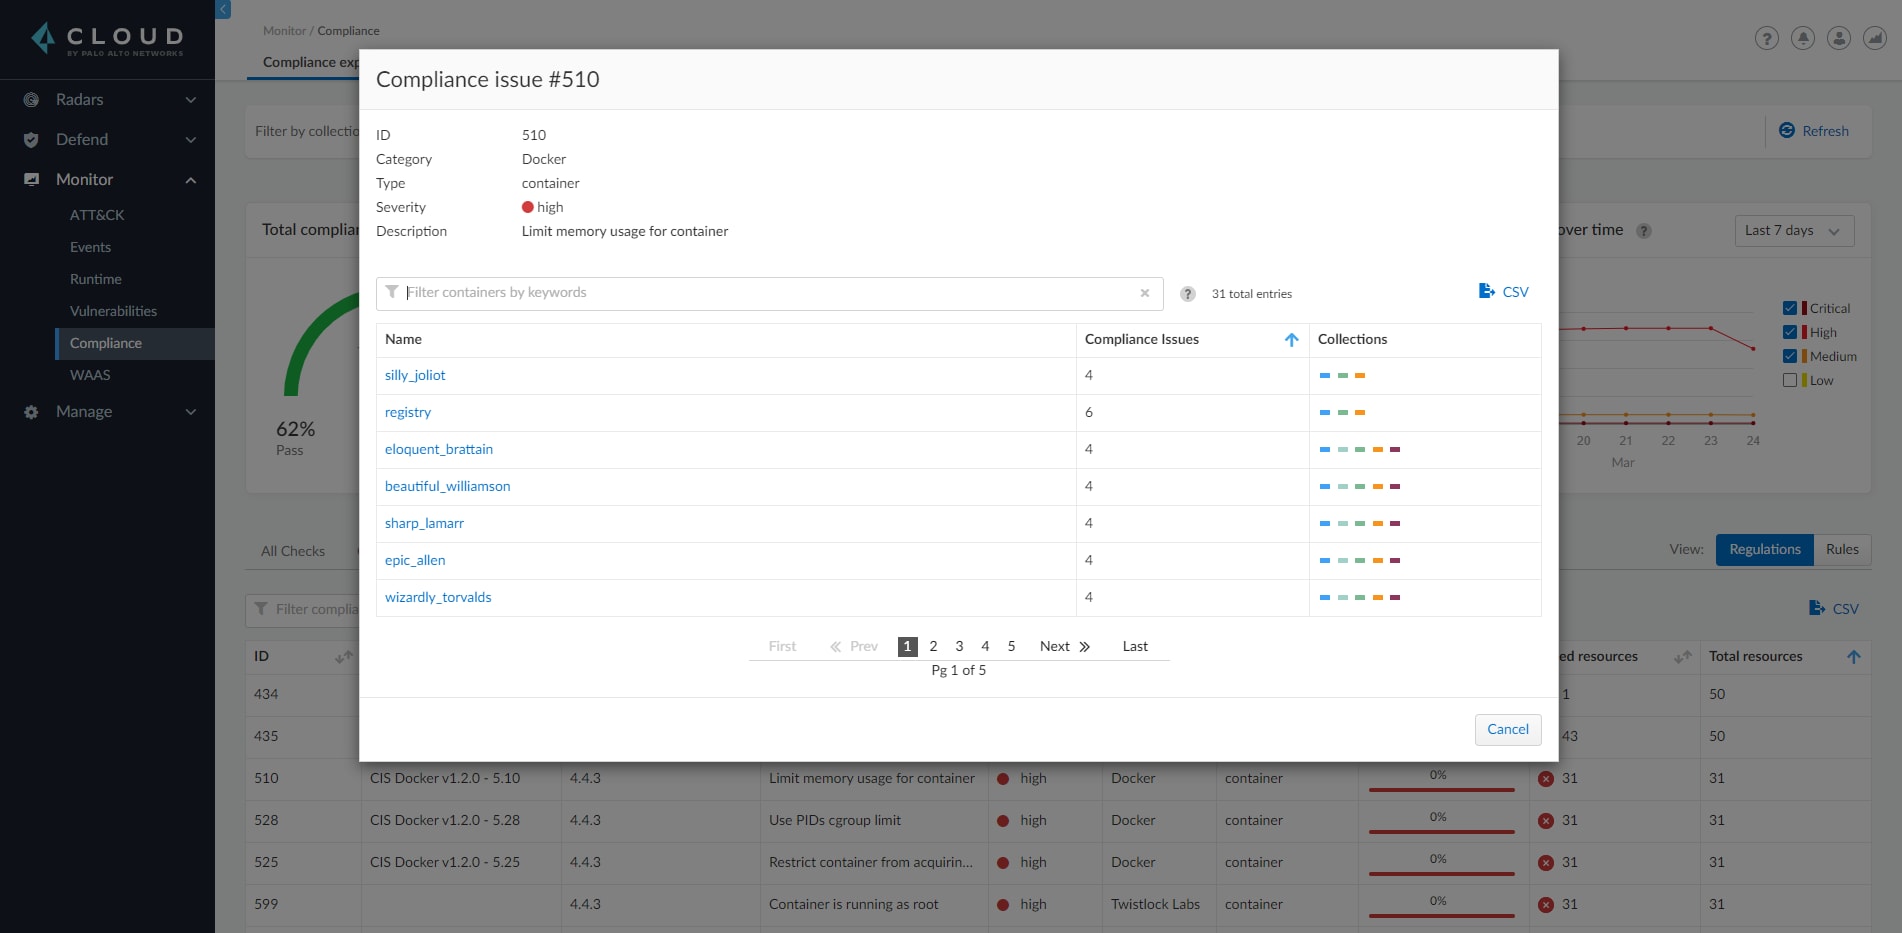
Clicking on a specific check will show the list of resources that failed that check, which you can also export in order to further evaluate any issues.
Understanding Compliance Against Internal Policies
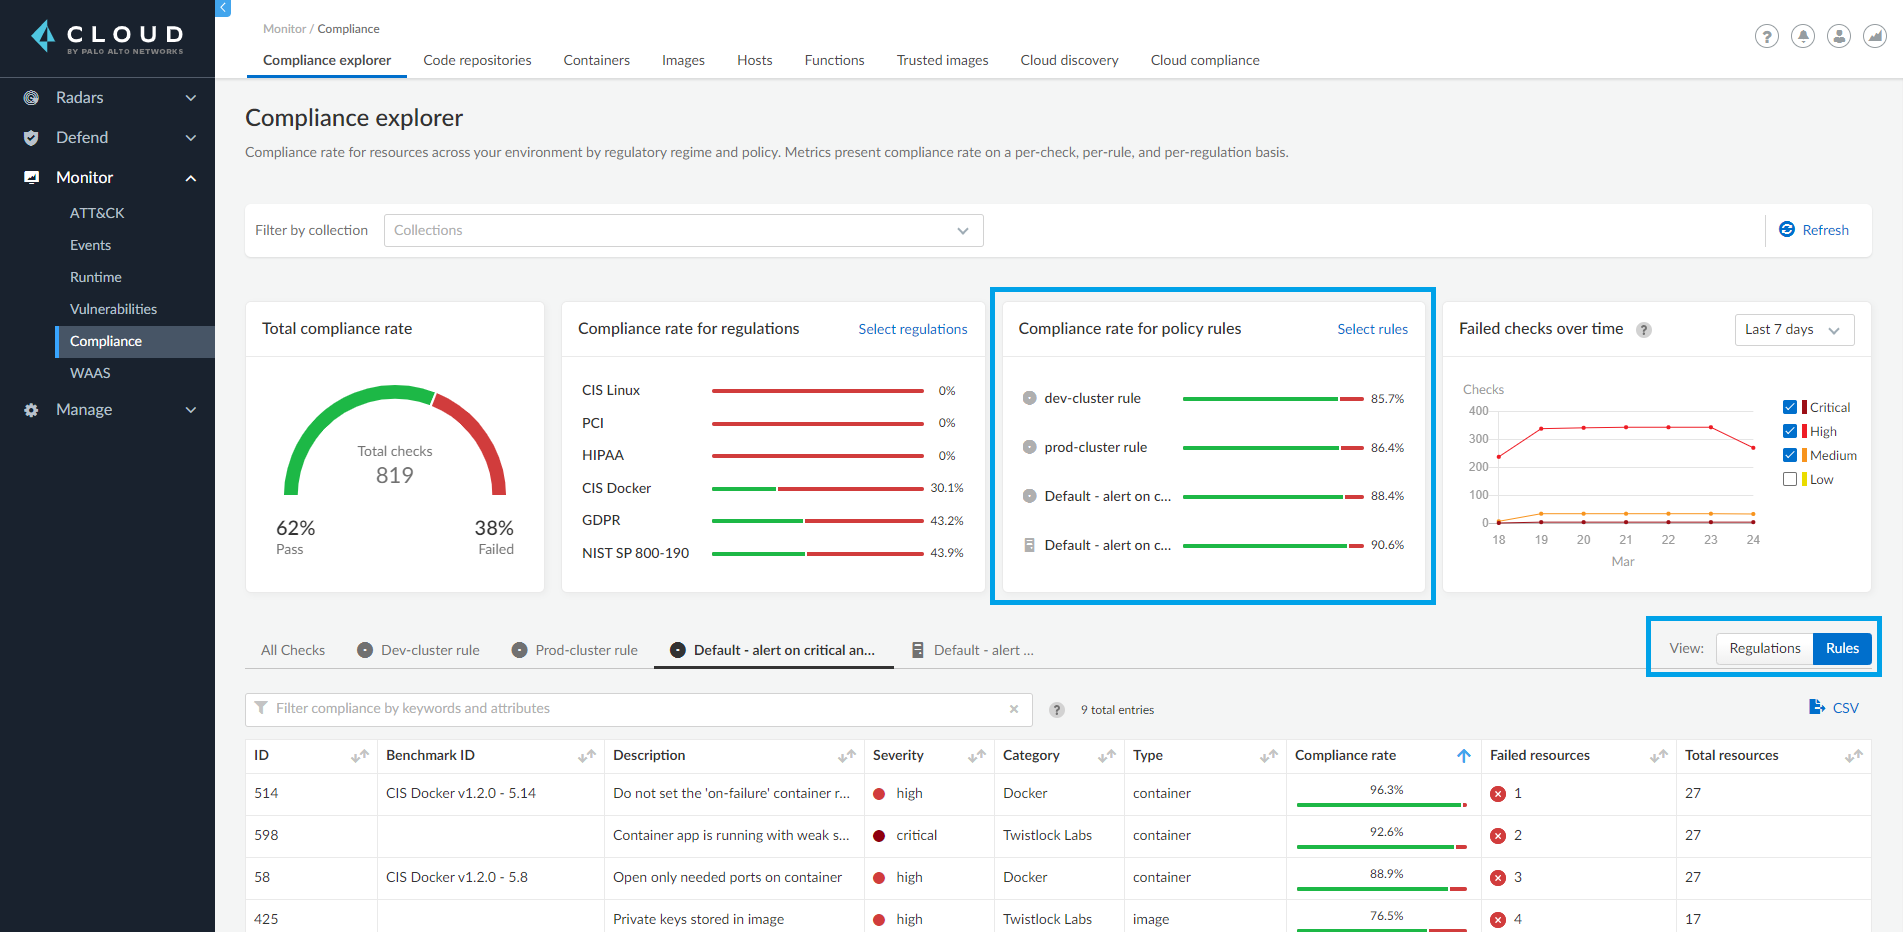
Many organizations choose to customize compliance reports to fit their needs by adding additional checks or ignoring irrelevant ones. For these use cases, the new compliance dashboard also allows users to see compliance metrics against user-defined policy rules within Prisma Cloud.
Similar to the pre-built frameworks, you can select the relevant rules and review the compliance rate by switching to the “Rules” view to get the detailed compliance findings of each policy rule.
Further Capabilities to Enhance Compliance Visibility
To help you quickly understand the holistic state of your environment, the new dashboard provides a "total compliance rate" view. This is created by aggregating all scanned resources and the total set of compliance checks evaluated on each one.
Furthermore, you can view the overall trend line for compliance checks to help assess your adherence over time and gauge whether workloads are within thresholds defined for your organization.
Finally, different segments of an organization's environment, such as clusters or namespaces, are often tracked against different compliance standards and internal policies. In these cases you can apply the "collections" filter to review separate metrics for these specific segments.
Start Using the Compliance Explorer
The latest enhancements to the compliance dashboard are available in the April 2021 release for Prisma Cloud. These updates provide powerful visibility into compliance issues, allowing organizations to identify where the most critical misconfigurations reside, prioritize follow-ups and track the progress of fixes. You can read more complete details in the technical documentation for Compliance Explorer.
And to learn more about other compliance capabilities from Prisma Cloud, check out our related blogs: